When a proxy list misbehaves, the useful message to a teammate or to support is not "some of them are dead". It is a report that says which ones, since when, and why. ProxyDesk builds one for you: paste the list, read the import preview, let the batch test run, and press Copy report for support. You get plain text with a timestamp, a count, and one line per proxy with its latency or its cause of failure, ready for a ticket, a chat or a diff against yesterday's run.
This walk-through uses ProxyDesk's own code for every format and field, and the screenshots carry sample data. The ProxyDesk setup guide covers installing the app.
Step 1: paste the list and read the preview
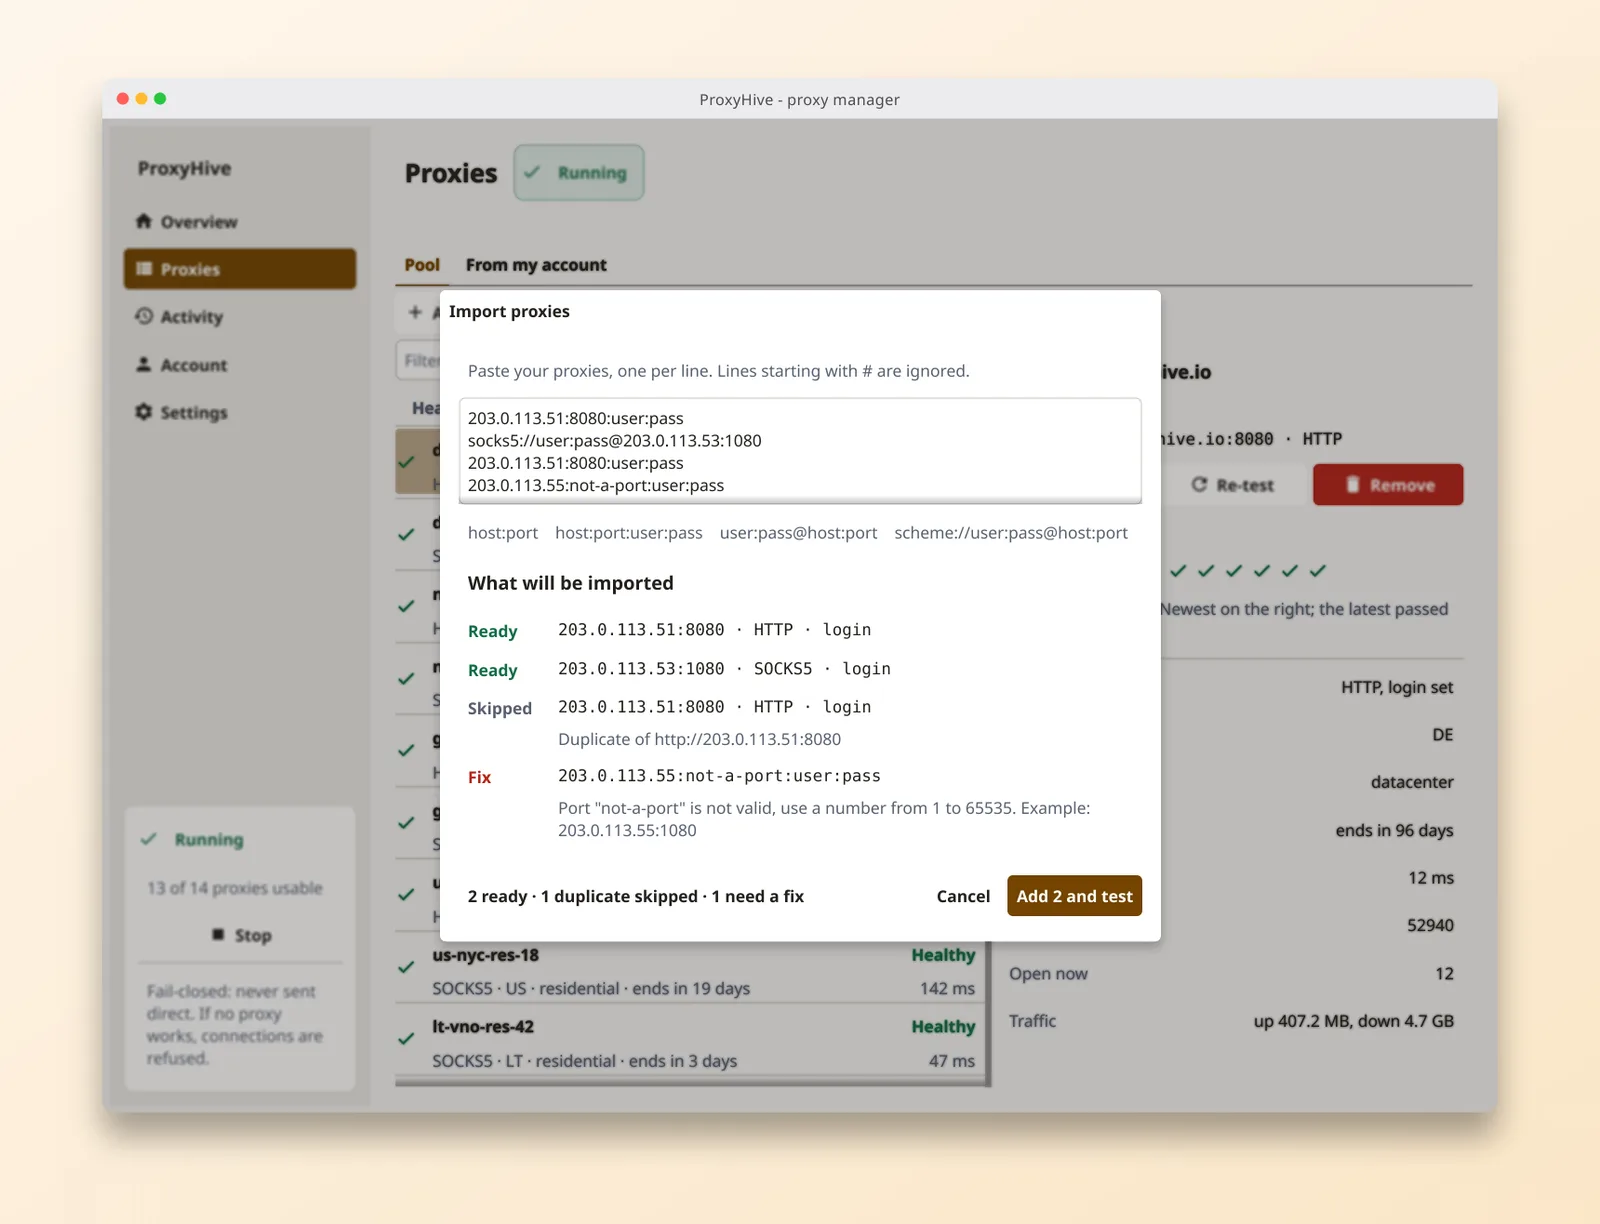
On Proxies, press Import and paste one proxy per line. ProxyDesk reads host:port, host:port:user:pass, user:pass@host:port and scheme://user:pass@host:port, and skips lines that start with #, so you can keep comments in a shared list file.
Nothing is added while you paste. Each line gets a verdict in the preview:
| Preview | Meaning |
|---|---|
| Ready | Parsed: shows the address, the protocol, and whether a login is set |
| Skipped | A duplicate, with the line it repeats |
| Fix | Not usable as written, with the reason and an example of a valid line |
A tally sits under the preview, such as 2 ready · 1 duplicate skipped · 1 need a fix. That tally is the first thing worth sharing: a list where a fifth of the lines need fixing is a list problem, not a proxy problem, and the preview has found it before any test ran.
Step 2: run the batch test
Press Add 2 and test (the number follows the ready lines). The Test all button on the Proxies page runs the same test over everything already in the pool.
For each proxy, ProxyDesk opens a connection through it to the test address, example.com:80 unless you changed it in Settings, and closes it again. It runs eight proxies at a time and gives each 10 seconds. A proxy whose plan has ended is reported as dead without being dialled. The results go straight into the pool: dead proxies leave rotation and are retested on their schedule, working ones are marked healthy.
The results panel puts the dead proxies first, each with its cause and what to do about it, then the working ones with their latency. Its headline is the summary in a few words: All 4 reachable, or 3 reachable, 1 dead.
Step 3: copy the report
Copy report for support at the bottom of the panel copies the whole result as text. The format, from ProxyDesk's source, with placeholders in angle brackets:
ProxyDesk proxy test report
Version: <app version>
Time: <UTC time in RFC 3339>
<reachable> of <total> proxies reachable, <dead> dead

[reachable] <name> (<host:port>) <latency>ms
[dead] <name> (<host:port>): <cause>
       raw error: <the error as the proxy or the network reported it>
The version line appears when your build carries a version number. The <name> is the proxy's label, or its scheme and address when it has none. Two dead lines as ProxyDesk words them, with documentation addresses in place of real ones:
[dead] socks5://203.0.113.53:1080 (203.0.113.53:1080): Login refused by the proxy
       raw error: socks5 upstream rejected credentials
[dead] http://203.0.113.57:8080 (203.0.113.57:8080): 407 Proxy Authentication Required
       raw error: upstream refused CONNECT: 407 Proxy Authentication Required
Unlike the results panel, the report keeps the order of your list, which is what makes two reports comparable.
Read it line by line
Time is UTC, so a teammate in another time zone reads the same moment you do.
The count line is the headline for a ticket: how many of the list worked at that moment.
A reachable line's latency is how long it took to open a connection through the proxy to the test address: reaching the proxy, its login, and the proxy's own connection onward. No page is downloaded, so it is not a page load, and one figure per proxy is one sample. Compare it within the same report, between proxies tested at the same moment from the same machine, and do not compare it with a number someone measured elsewhere.
A dead line's cause is ProxyDesk's plain reading of the failure, and the raw error underneath is the evidence for it:
| Cause | Usually means |
|---|---|
| Login refused by the proxy | Wrong username or password |
| 407 Proxy Authentication Required | An HTTP proxy that wants a login it did not get |
| Proxy cannot be reached | Wrong host or port, a firewall, or the proxy is down |
| Proxy did not answer in time | A slow route or a filtered port |
| Proxy address could not be looked up | A typo in the host name, or no DNS on your side |
| Proxy sent an unexpected reply | The type does not match the port: HTTP against SOCKS5 |
| This plan has ended | The plan behind the proxy has expired |
The proxy error codes guide goes deeper on 407 and on errors that come from the target rather than the proxy.
What to add, and what to leave out
The report has no field for a username or a password. It does carry each proxy's host and port, so keep it inside the team and the support ticket, not in a public issue tracker.
What the report does not say, add yourself in one line above it:
- Where it ran from. The latencies include your own connection. "From the scraping box in the office" and "from home" are different measurements.
- The test address, if you changed it from the default.
- What you were doing. "After rotating the password on the account" turns a list of login refusals into an explanation.
Two other ProxyDesk exports round it out. Copy diagnostics on the Activity page adds the app's state: the local addresses, whether a local login is required, connection and traffic totals, health-check traffic counted separately, and each proxy's status and next retest, with logins shown only as yes or no. Export CSV adds the recent connections themselves, with the columns time, destination, upstream, result, cause, error, bytes_up and bytes_down, when the question is what happened to real traffic rather than to a test.
A routine for a team
- Agree a test address. Everyone tests against the same
host:port, set in Settings, or results are not comparable. - Test from where the job runs. A list that works from a laptop can fail from a data centre subnet, and the other way round.
- Save each report with its date and paste it into the ticket or the channel as text, not as a screenshot, so it can be searched and copied.
- Retest after every fix. Edit login on a proxy saves and retests in one step; Test all reruns the lot.
- Diff the runs. Because the order follows the list, two runs over the same list line up, and a plain diff shows only what changed:
diff report-2026-11-05.txt report-2026-11-06.txt
A report is evidence about one moment from one place. It tells you which proxies answered and why the others did not; it does not tell you which proxy a target site will accept, or how often. That is a different test, with many requests per target and a success rate at the end, and our benchmark guide has the method. For a quick look from a browser instead, the extension's Test button gives a similar one-request check per proxy, and what it measures explains how far to trust it. The ProxyDesk page shows the import preview and the activity log in both themes.